
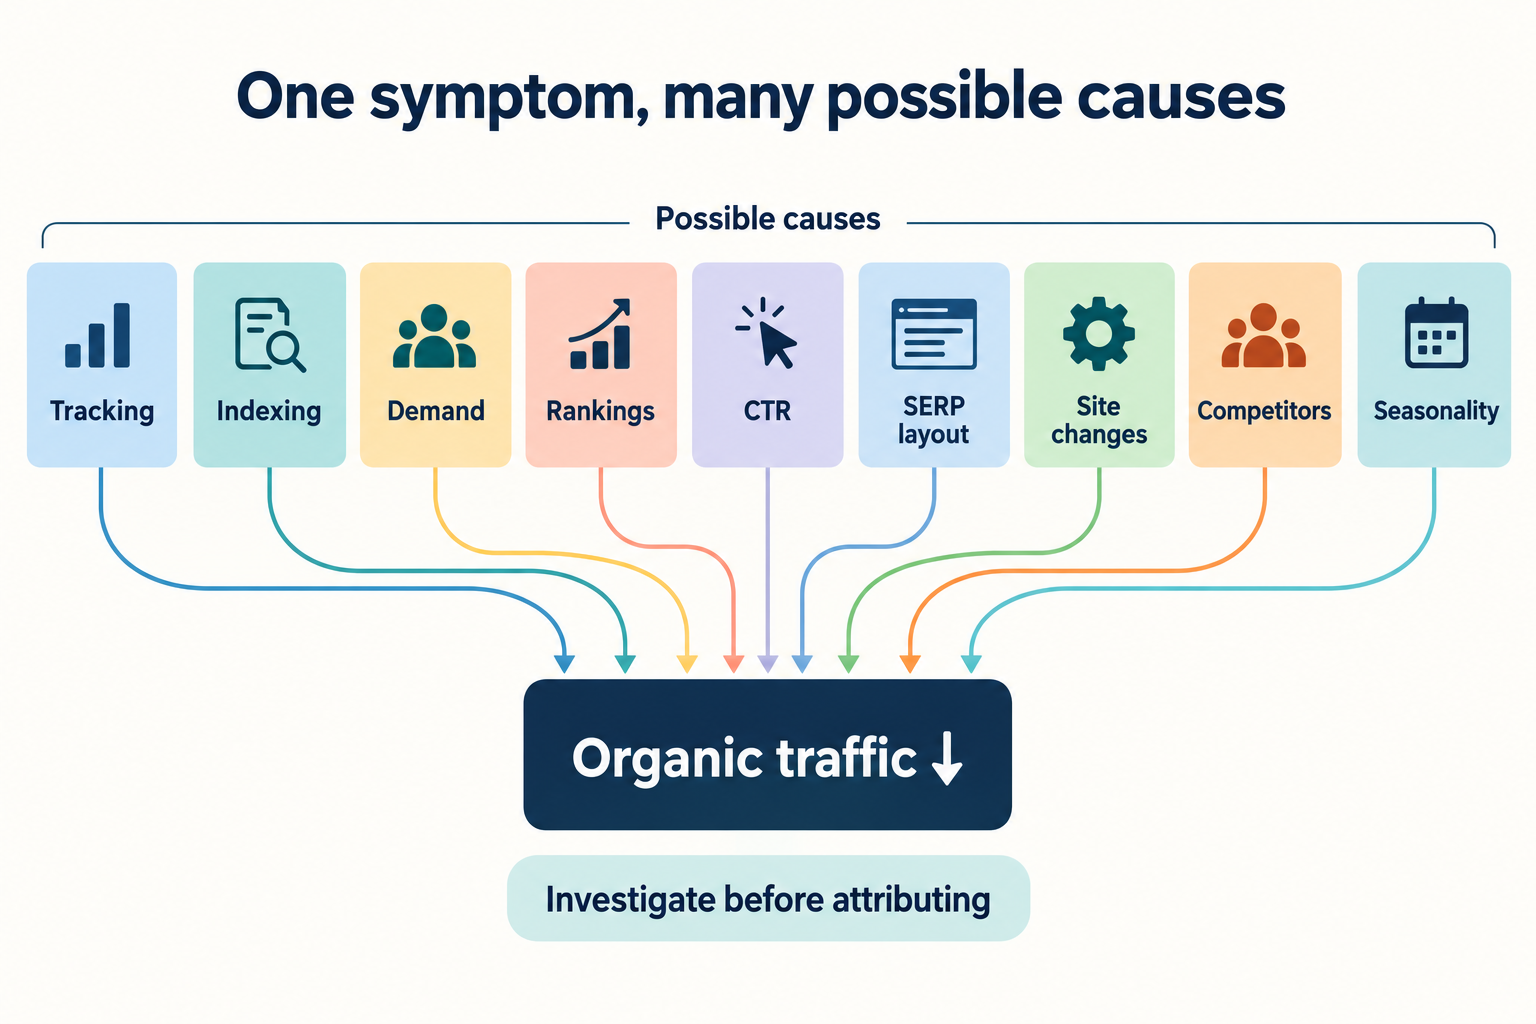
An organic traffic chart falls after a site release. The release is an obvious suspect, but the timing is not a diagnosis. Search demand may have changed, the analytics tag may have stopped firing, a page group may have lost visibility or the results page may be attracting fewer clicks.
Different mechanisms can produce the same visible symptom. A useful investigation narrows the affected population, tests the measurement and looks for evidence that distinguishes competing explanations.
Define the decline before explaining it
Specify the metric, source, date range and comparison. Search Console clicks are not analytics organic sessions. They use different collection and attribution rules, and consent or tracking changes can alter analytics without an equivalent search change.
Compare like periods where possible, accounting for weekdays, holidays and incomplete recent data. Segment by page group, country, device and relevant query class. A sitewide total can hide a decline concentrated in one template or a seasonal topic.
Check the measurement, then search availability
Start by testing the analytics implementation and reviewing recent consent, tagging and channel-definition changes. If search clicks remain broadly stable while reported organic sessions fall, investigate measurement before rewriting the site. The sources need not match exactly for their divergence to be useful evidence.
Next inspect availability and indexing for representative affected URLs. Check current status codes, unintended noindex directives, access restrictions, canonical changes and the timing of template deployments. A confirmed mechanism affecting the same page group is more useful than a general claim that “Google dislikes the site.”
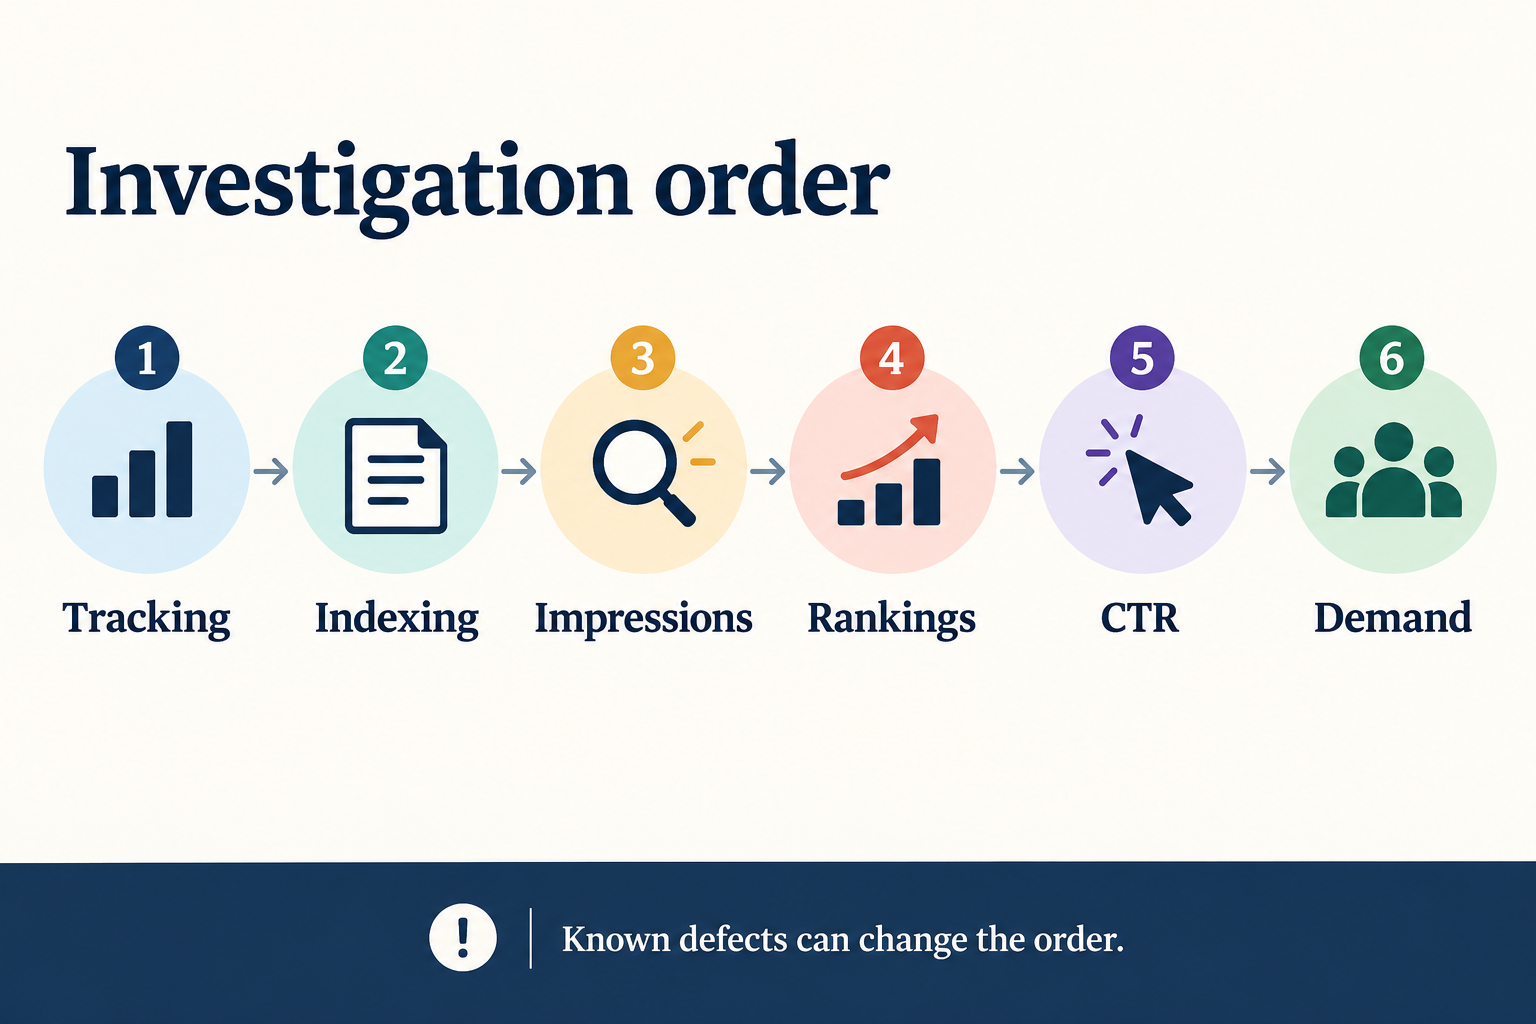
The sequence below is an investigation aid. An outage or a directly observed indexing defect can justify jumping to that branch immediately; you do not have to complete every earlier check before fixing a known problem.
Separate impressions, position and click-through rate
Fewer impressions may reflect lower demand, reduced eligibility, weaker positions or a change in query mix. A lower click-through rate can reflect position changes, different result features, different queries or a less compelling result presentation. None of these signals uniquely identifies a cause.
For the same reporting population, clicks equal impressions multiplied by CTR. That accounting relationship helps describe where a change appears; it is not a causal model. Aggregated averages can move because the mix of queries or pages changed even when individual query-page pairs did not move in the same direction.
| Pattern | Working hypothesis | Next discriminating check |
|---|---|---|
| Analytics falls; search clicks broadly stable | Measurement or attribution changed | Test tags, consent and channel rules |
| A template loses indexed URLs | Availability or indexing issue | Inspect affected and unaffected URLs |
| Impressions fall for a seasonal query group | Demand may have changed | Compare prior seasons and independent demand context |
| CTR falls within a comparable query group | Position or result presentation changed | Review positions and dated result observations |
Investigate demand and competition
Seasonality can operate by week, holiday or product cycle. Compare prior periods carefully: last year may contain a different campaign, launch or unusual event. External trend tools add context, but their normalized values or estimates should not be treated as your site’s measured search volume.
Competitors can change their content, inventory or presentation. Search layouts can also change. Keep dated observations for relevant query groups rather than relying on memory of a single results page. Use metric definitions and limitations when interpreting average position and third-party visibility scores.
Put releases and updates on one timeline
Record site deployments, content changes, tracking changes, documented search updates and demand events. A nearby event suggests a hypothesis, not proof. Several may overlap, and a search system may process a site change after a delay.
Google’s traffic-drop guidance is a useful source for investigation categories. Apply it to the affected data rather than treating every decline as an algorithm penalty. Check manual-action and security reports when relevant instead of inferring their contents from a chart.
Close with evidence and the next test
A useful conclusion distinguishes confirmed defects, plausible explanations and unresolved questions. “The new template returned noindex on the affected pages” is a supported finding if reproduced. “That defect explains every lost visit” requires more evidence.
Choose the smallest action that addresses the best-supported mechanism, preserve the before state and set a review window. The diagnostic framework helps locate the failing stage; research methods helps design comparisons and explain what they still cannot prove.